Intro
Transformers! They’re the workhorse of modern generative AI: GPTs make text, DiTs make images, et al. I assume you’re familiar with them since you’re reading this.
At the heart of every Transformer is one operation, repeated over and over: the matrix multiplication. They’re the dot products between your query, key, and value matrices in attention; the linear projections in feedforward networks; the weight matrices in embedding layers. Almost every meaningful chunk of computation in a Transformer boils down to some flavor of A @ B = C
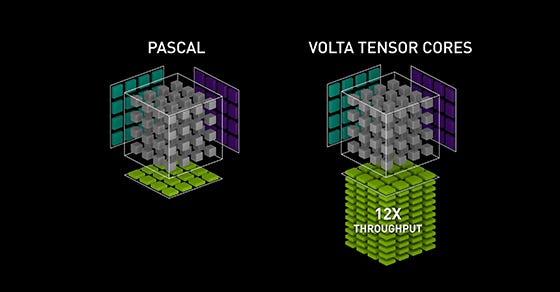
So, one day, engineers at NVIDIA — for a long while, the only viable providers of AI compute — asked: what if we made dedicated cores for this kind of operation? And so, with Volta, Tensor Cores were born!
These cores are specialized compute units that accelerate small matrix multiplications (originally 4x4, then scaling up with newer generations), trading off a bit of flexibility for massive throughput, especially in mixed-precision formats like FP16 (and later) BF16.
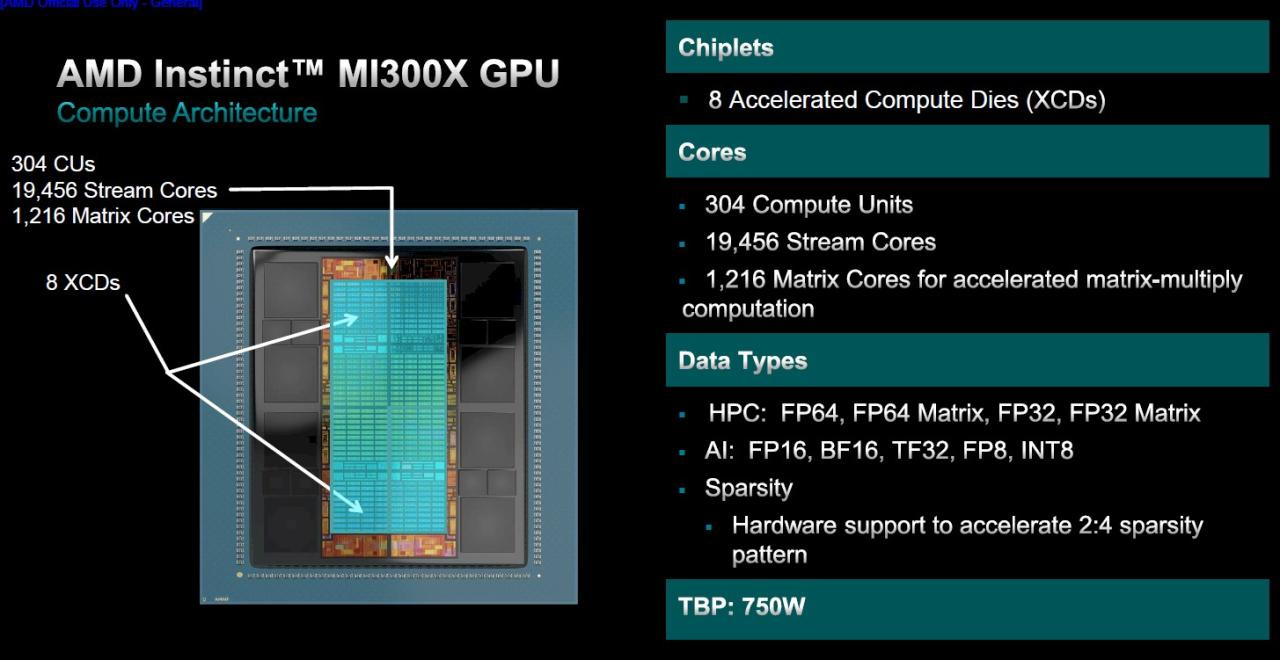
Sometime later, AMD, seeing NVIDIA’s stock mooning, decided they wanted a slice of the AI pie and began work on their own version: Matrix Cores; not exactly the same thing hardware-wise, but the objective was the same: eat matrices, spit out FLOPs.
The CDNA-3 based Instinct MI300X, as shown above, packs 1.2k of these linear algebra solvers.
But one day, I woke up and wondered: how good are they? — or more specifically, as is often the question with AMD and AI, is the software up to the task?
Methodology
Using a single MI300X on a VM (thanks Hot Aisle/AI at AMD!) with the latest ROCm/PyTorch at the time of writing (6.4/2.5.0) from one of the official docker containers, I decided to figure it out myself. Note that I’m going to be testing just PyTorch-ROCm, I don’t care about your favorite LLM inference library.
For a quick reminder, the software stack in PyTorch goes something like this: PyTorch (Python) → ATen/TorchInductor (C++/IR) → HIP (AMD’s CUDA-like API) → rocBLAS or custom kernels → ROCm runtime → GPU
You’re gonna hear the acronym MFMA a lot. It’s AMD-ism for Matrix Fused Multiply-Add, what they call the optimized matmul kernels. NVIDIA calls it WMMA (Warp Matrix Multiply-Accumulate). Also, the precision in these experiments is always BF16.
ROCm ships with something called rocprofiler that lets me specify some counters to keep track of and something to execute, which it then runs and spits out a .csv with a bunch of useful info. More specifically, I’m using rocprofilerv3
The Experiments
So, my objective here is to find out how effectively PyTorch can utilize the matrix cores, so normally I need something synthetic to be able to compare against. A kind of best-case scenario.
I settled for two options: a simple script running torch.matmul on an 8192x8192 matrix, and something I will call a Matmulformer, which is basically the result of me asking o3 to make me a simulated transformer but with pure torch.matmul and doing “forward passes” but with random tensors.
As for the real-world load, I’m using Karpathy’s nanoGPT, training the GPT-2 (124M) reproduction, with the hparams adjusted to saturate the MI300X — batch size 128, block size 2048.
We’re gonna be focusing on two very informative counters: SQ_VALU_MFMA_BUSY_CYCLES, and SQ_BUSY_CU_CYCLES.
The former counts how loaded the matrix cores are with MFMA instructions, and the latter is a more general count, as in, number of cycles the GPU spent doing anything. Also, I’m always doing two passes: one without the profiler, to get general speed figures, and another with. After that I filter for only matrix multiplication operations (the profiler gives figure per-op) for my numbers.
I was originally planning on starting this just comparing the nanoGPT run to a synthetic one (don’t worry, that’ll appear eventually here), but I stumbled upon a very interesting performance differential when testing out the Matmulformers.
Scaling is… key?
The script simulates a single Transformer layer, which by default o3 decided to make huge: d_model of 12288 with 4x FFN multiplier and 96 heads. I also had it add Weights and Biases logging to the simulation, because it provides very useful metrics like GPU power usage and stuff.
Anyway, I scaled down to GPT-2-style size (d_model 768, 12 heads), and I lost 50% of the performance!
What’s going on?
So, I checked out the profiler figures for an explanation:
It turns out a big “model” is way more effective at saturating both the normal and matrix compute units. Now I knew that GPUs liked ‘em big, but I didn’t expect the gap to be this wide!
Thanks to wandb I have some other metrics that could help me.
There’s no meaningful difference in power consumption between the two runs, so it’s not like the GPU is physically-doing more?
Aha, now I see! The smaller “model” wastes time shuffling around HBM memory, while the bigger one focuses more effectively on crunching numbers with optimized kernels. Not all GPU time is the same
And yes, before you wonder: I did tune the batch size independently for both runs to ensure each consumed as much VRAM as possible.
Wait! Before drawing too many conclusions, do remember this isn’t a real model, but a bunch of torch.matmuls that o3 thinks resemble a transformer. But it is interesting, regardless.
But with that out of the way, let’s get to the real model!
nanoGPT Test
Now that I have some theoretical numbers, it is time to test how well they compare to a real-world workload, or well, something like it. Let’s reproduce GPT-2-124M on FineWeb, but not really (that means I only trained for 40 minutes, not until convergence, which would take days).
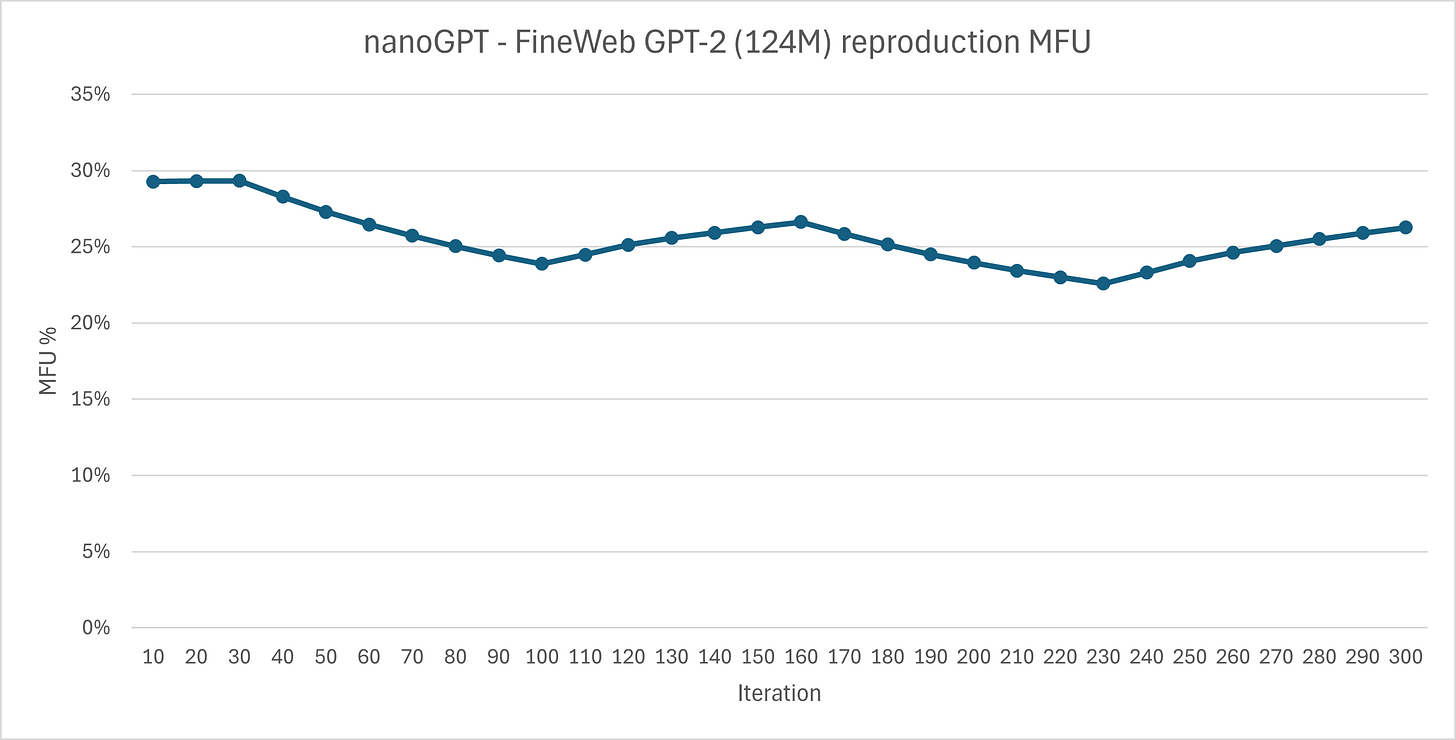
Conveniently, the trainer logs MFU, Model Flops Utilization, which measures how many FLOPs you’re actually getting, as % of the theoretical maximum. After changing the theoretical value from that of an A100 (312 TFLOPs) to an MI300X (1,307 TFLOPs dense), I got about 25-30% MFU
That looks bad, doesn’t it? Well actually it’s within the normal range, according to an issue on the nanoGPT repo. Someone reports 29%, and a comment alleges 28.49% officially for 4xA100s.
Let’s look at the power usage chart that wandb logged.
GPU isn’t getting any chill here.
Alright! It’s time for the profiler run. Note that I only ran 20 iterations with the profiler on, because 1. the profiler slowed it down greatly, and 2. freezes if I let it go on for much more than 30.
But it should still work!
First is MFMA and second is busy CU. We can see that for a real-world task with dataloading, gradient backpropagation, and all the goodies that real training brings, the matrix core usage hovers at around 70-80% of a comparable synthetic run. For general compute units, it’s about 60%.
Considering the overhead of everything else, I’d say that’s pretty good.
Conclusion
Well, that’s all, folks. I’ve done some digging and found interesting things. Here’s a disclaimer tho: I’m not that well acquainted with the inner workings of GPUs, so while I’m trying my best to be fair, there might be something I’ve missed here.
So yeah, maybe next steps are to see: if I scale the nanoGPT model up, will I get the same performance increase as with the matmulformers?
For now, I end off here.
Reproducible
To reproduce the matmulformer, go here and download all the files. Then run this:
rocprofv3 -i metrics.txt --output-directory ./pmc_runa -- python matmulmaxx_w.py --batch 48 --seconds 180
Or without the profiler.


